Thank you! Your submission has been received!
Oops! Something went wrong while submitting the form.
MENU

Around 38 million websites use Google Analytics for tracking, making it a powerful tool for tracking how visitors interact with your website, app, and marketing campaigns. When you know how to use Google Analytics, you can better understand:
However, Google Analytics is making some major changes to its platform. Most notably, it’s phasing out Universal Analytics (UA) by July 1, 2023, and replacing it with Google Analytics 4 (GA4).
In this article on Google Analytics for beginners, we’ll show you everything you need to know from how to set it up to which metrics are most important for your business success. If you want a sustainable business, you need some insight into the numbers. Even if you’re not familiar with metrics, search engine optimization (SEO), or data, we’ll help you master the basics.
Note: Google Analytics is under constant development and may change slightly after this post was published.
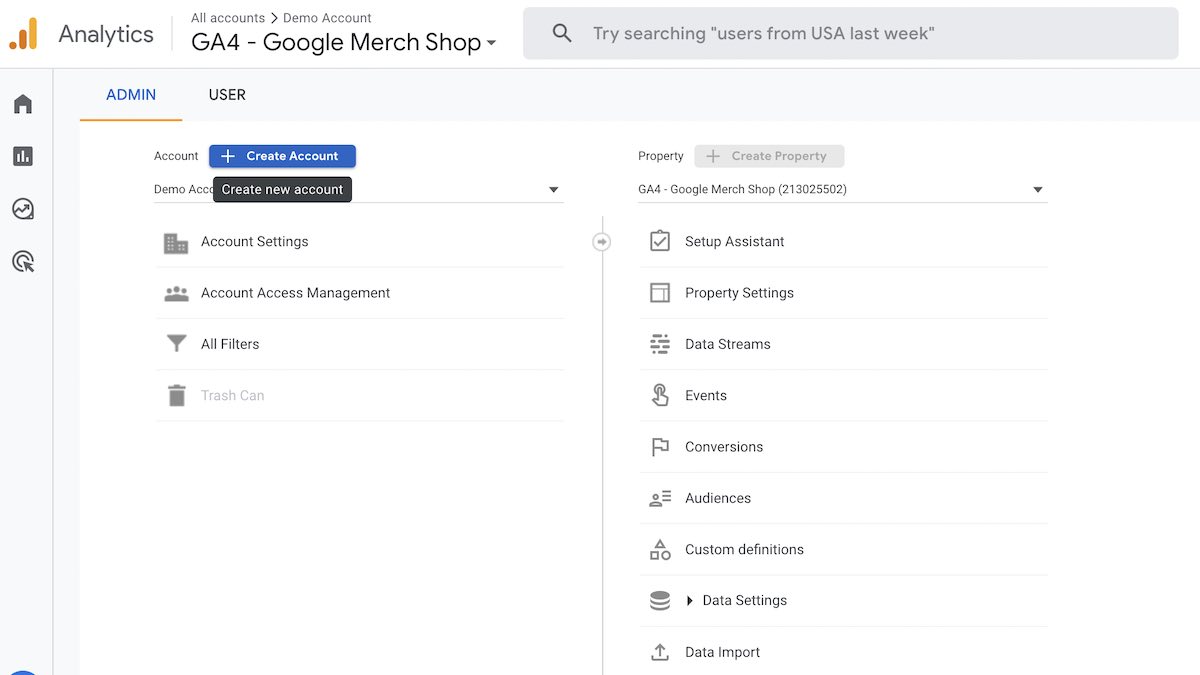
If you’ve never used Google Analytics before, first you’ll need to set up an account.
To do this, you’ll link your Google Analytics account to an email, preferably the professional email that you use for your business. Once you’re logged into Google Analytics, you’ll scroll down to Admin and click “Create Account”.
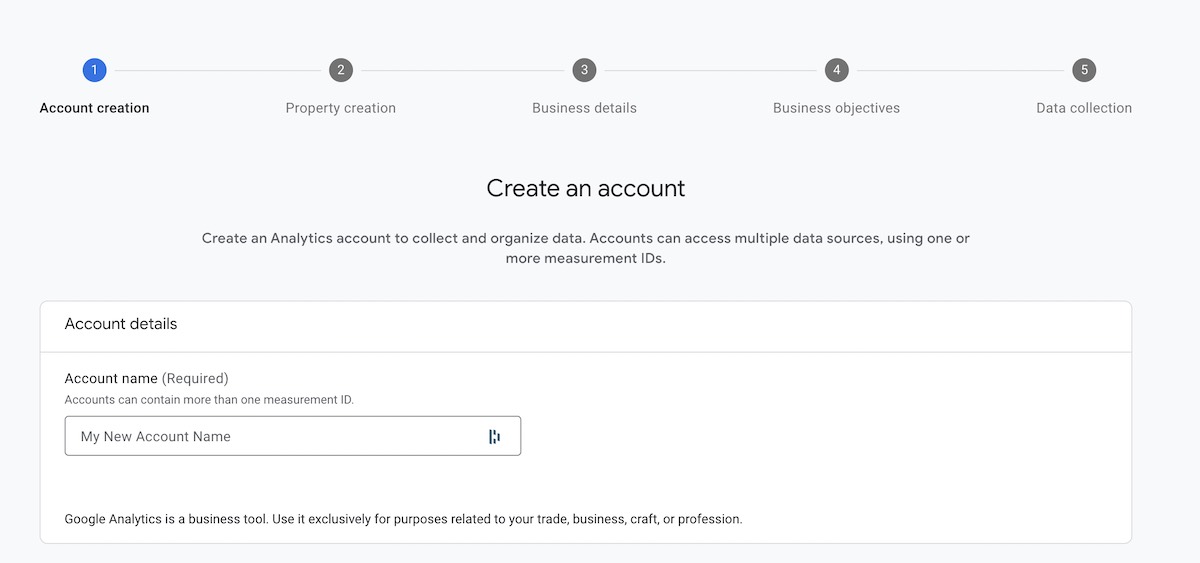
Next, you’ll name your account and create a property. Your account is usually your company and property is a website, blog, or mobile app that you want to measure. An account can host many different properties. For example, if you have a website for your personal brand and another for your company, you may have two or more properties.
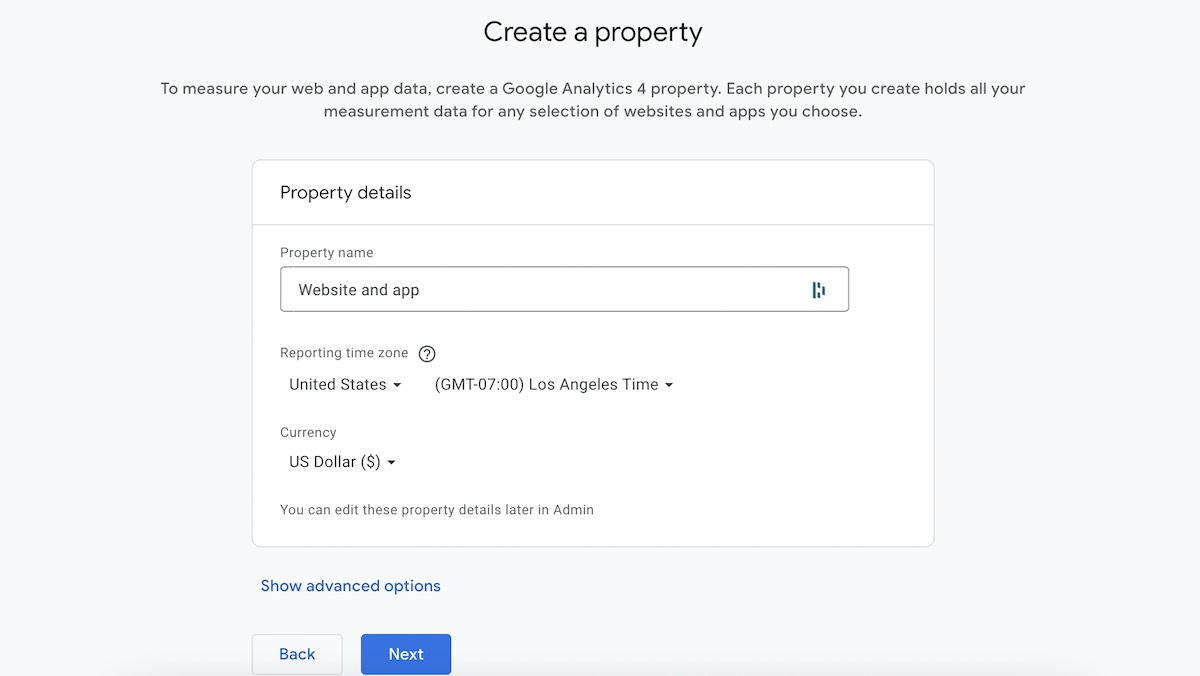
You’ll name your property and choose the time zone and currency.
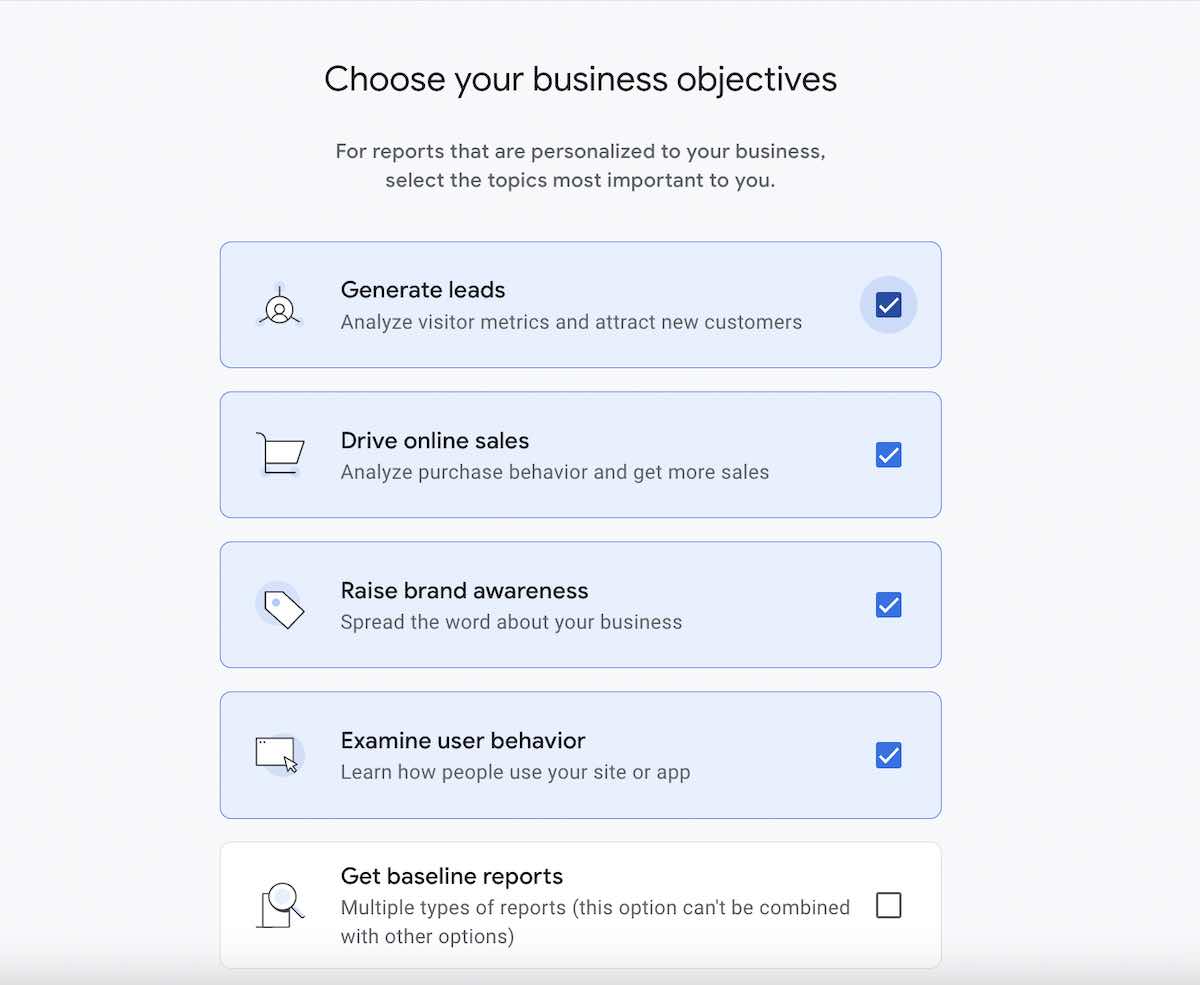
In the next step, Google gathers some basic information on your business industry and size. On step four, you’ll select your business objectives from a list. Most businesses will check these objectives:
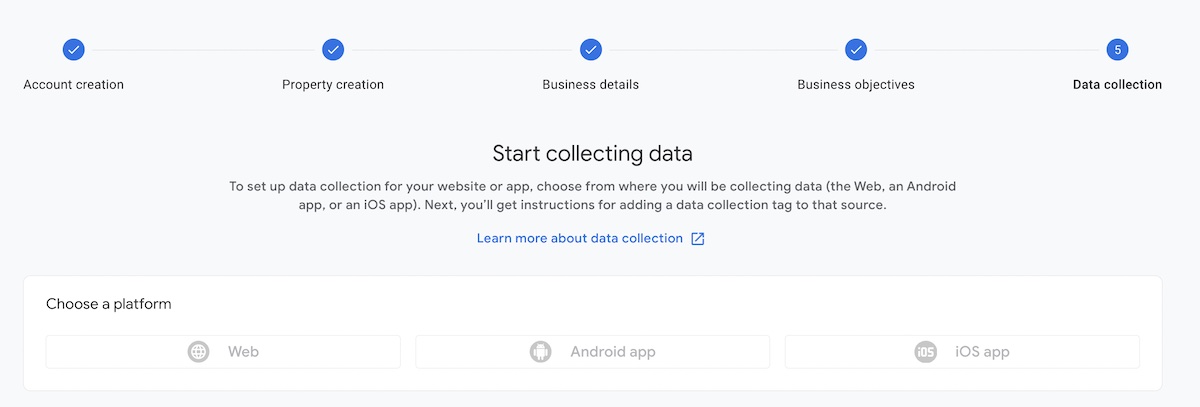
When you select “Create”, Google will ask you to accept its terms of service before going to the fifth and final step to create a Google Analytics account: “Data collection”. Here you’ll select what you want to collect data from—your website or mobile apps.
Although you select a platform to collect data from, Google Analytics won’t start pulling data until you set up the proper tracking code or data collection tag on your site. Google will share easy-to-follow setup instructions, but the guidance below will also help you integrate Google Analytics to your site and Teachable school.
Luckily for Teachable course creators, we make it easy to integrate Google Analytics into your online school. This will help you understand how your audience interacts with your Teachable school. First, you’ll need to have or sign up for a Teachable account and to create a Google Analytics account if you haven’t already.
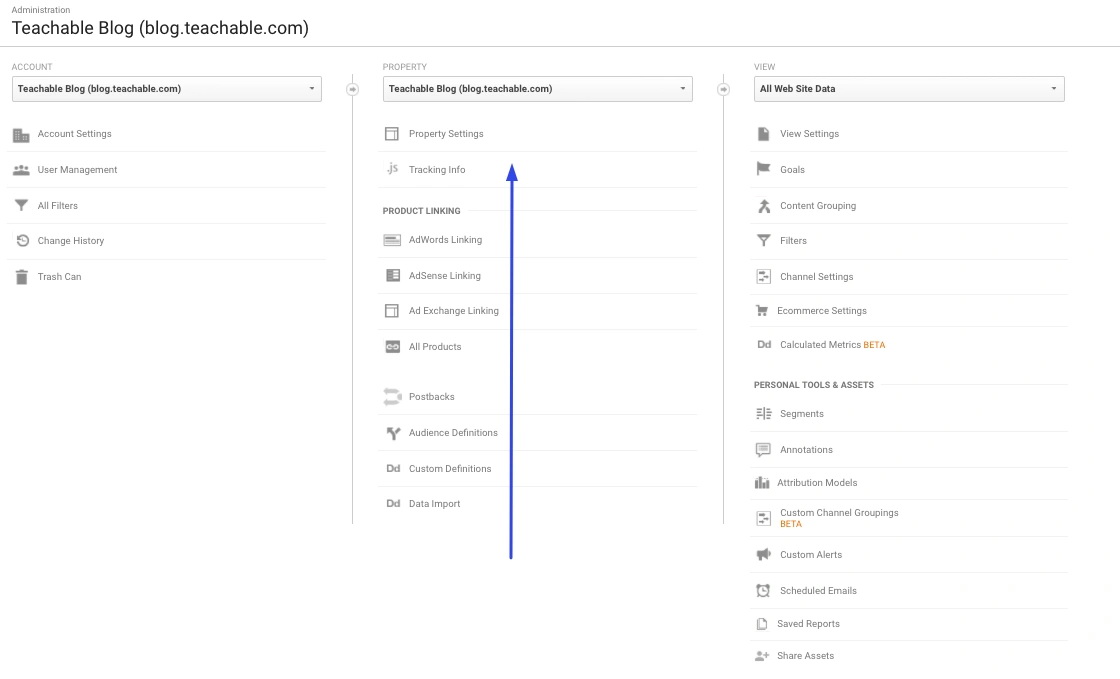
Now, find the Tracking ID for a specific property by going into Admin > Property > Property Settings. From there, your tracking ID will be at the top of the page.
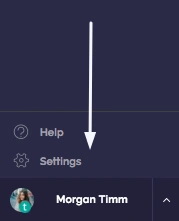
Once you’ve found your tracking ID, copy it and log into your Teachable school. Inside Teachable, click the settings button at the bottom of the sidebar.
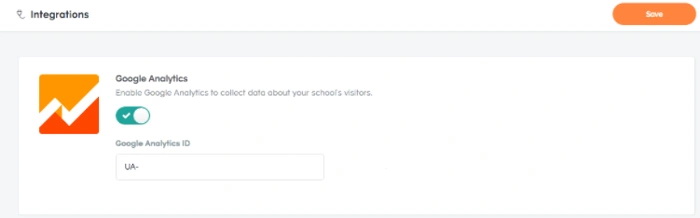
From there, a new sidebar will pop up, and you’ll click “Integrations”. Once you’ve clicked “Integrations”, the first option will be Google Analytics. Toggle the integration to “on” and paste your analytics ID in the space available. Don’t forget to hit save.
If you host your site or blog outside of Teachable, the steps you take to integrate Google Analytics will be a bit different depending on your platform. To connect Google Analytics to your site, you can go to the list under “Property” and click “Data Streams”.
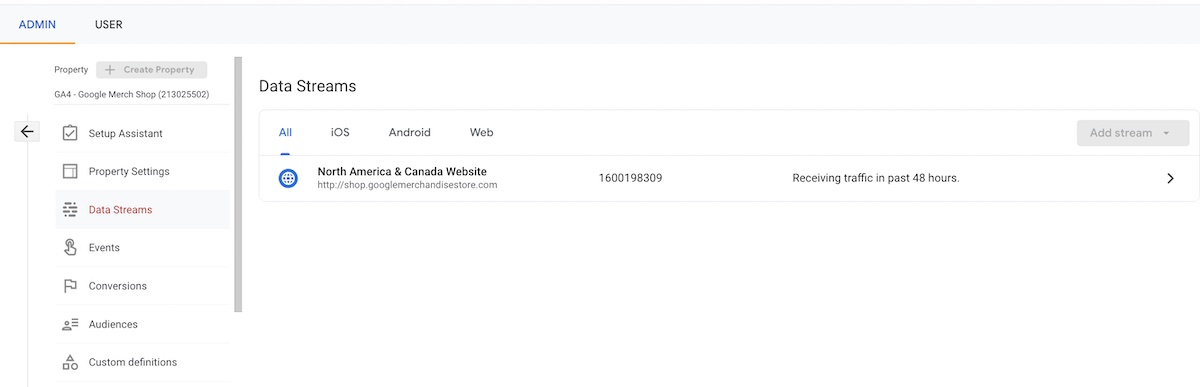
Then, you’ll see a screen like the one below. Later, you’ll use the IDs here to set up your Google Analytics tracking codes.
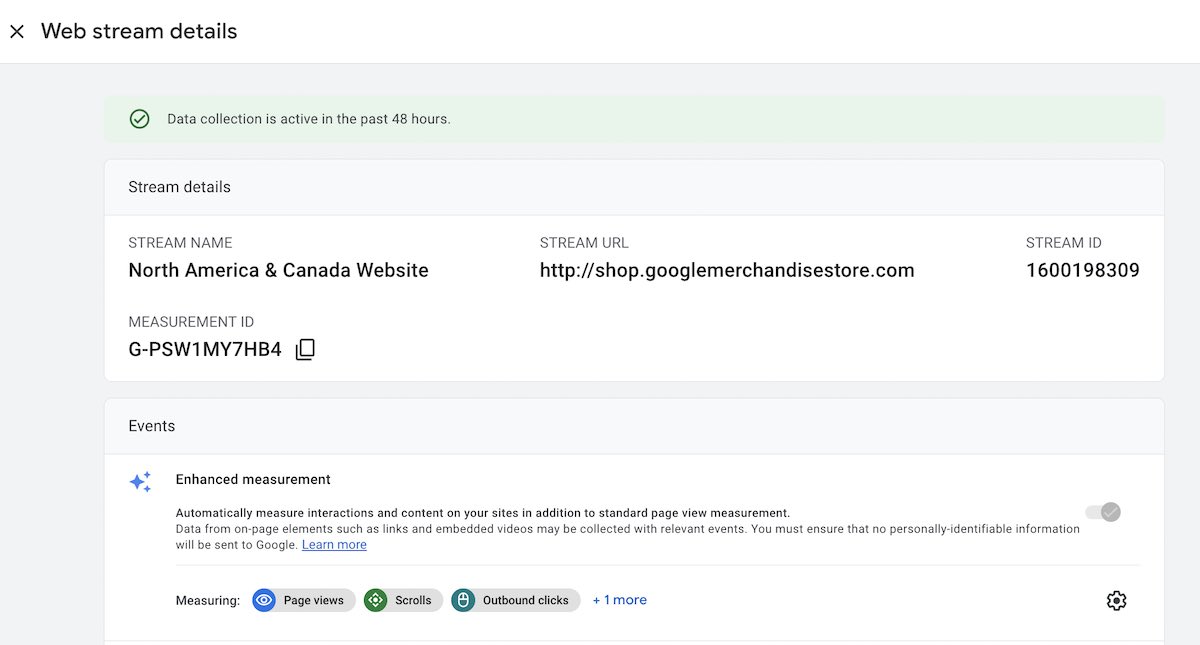
For now, you’ll scroll down and click the “View tag instructions” tab, and you’ll see two options: install with a website builder or CMS or install manually.

Because content management systems like WordPress and Squarespace are completely separate platforms with different interfaces, the instructions for them vary. Here are the steps for adding Google Analytics to some of the most common platforms:
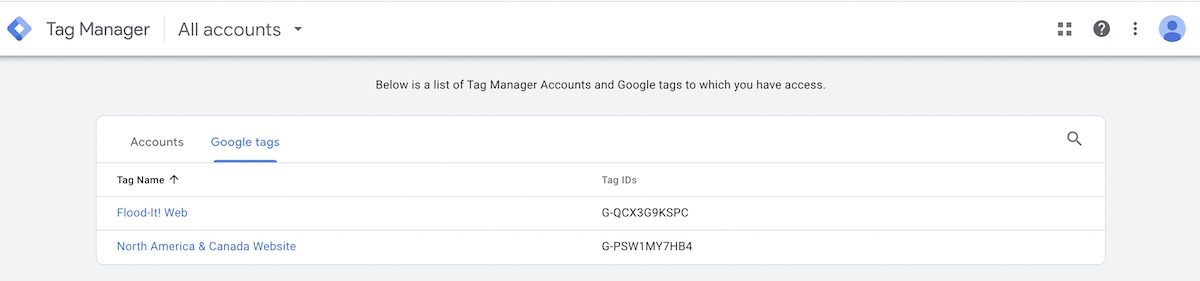
You can also add your Google Analytics tracking code manually to your site through Google Tag Manager (GTM). Another option is manually inserting a JavaScript code or gtag.js on each page you want to track.
It’s highly recommended that you go the GTM route. Inserting the code manually requires more development knowledge and it leaves gaps in your site tracking unless you install the code on all pages.
On the other hand, GTM makes it easier to set up tracking codes and manage them all in one place, without needing to know how to code. First, you’ll need to create a GTM account and connect it to GA4.
Before we look at the Google Analytics interface and metrics to understand how your site and business are performing, you should understand the differences between GA4 and UA.
Since Google Analytics is changing, you’ll want to know the biggest differences between GA4 vs. Universal Analytics. Google will stop processing data from UA after July, so if you currently use it, you’ll need to move to GA4 to get up-to-date data.
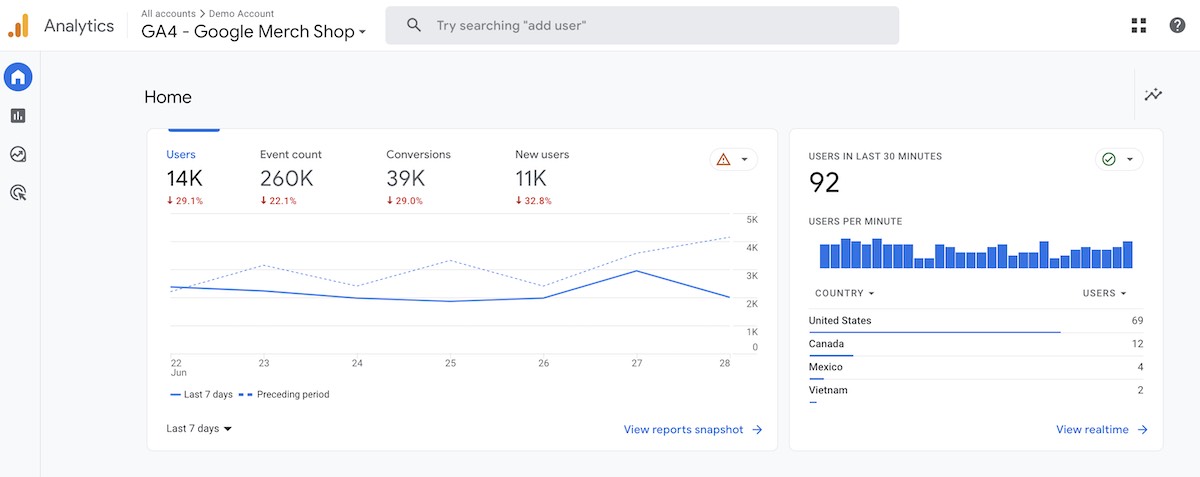
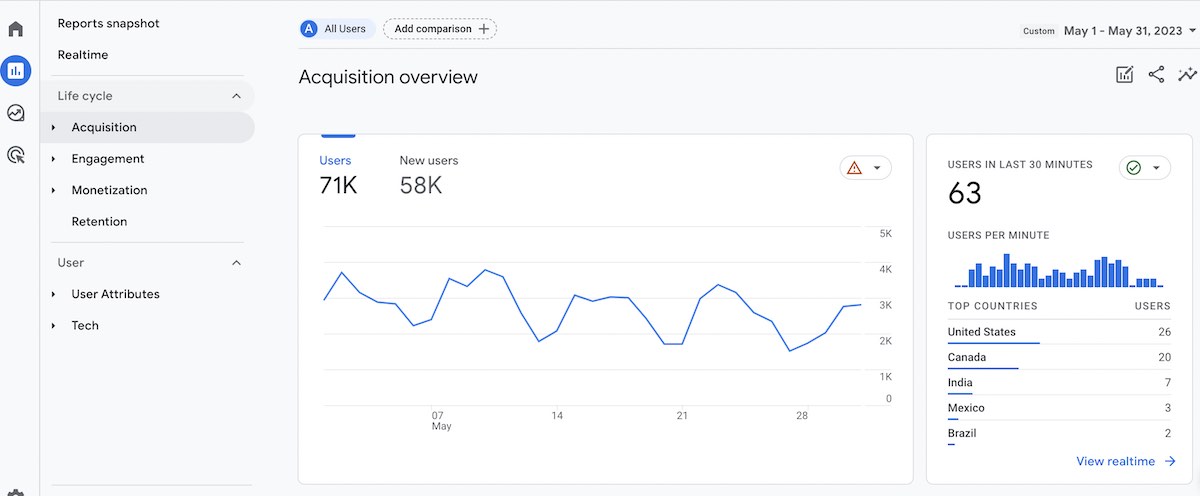
Even if you’ve used UA before, GA4 is quite different. For example, this is what the home view of GA4 looks like. You can view this with Google’s demo account data.
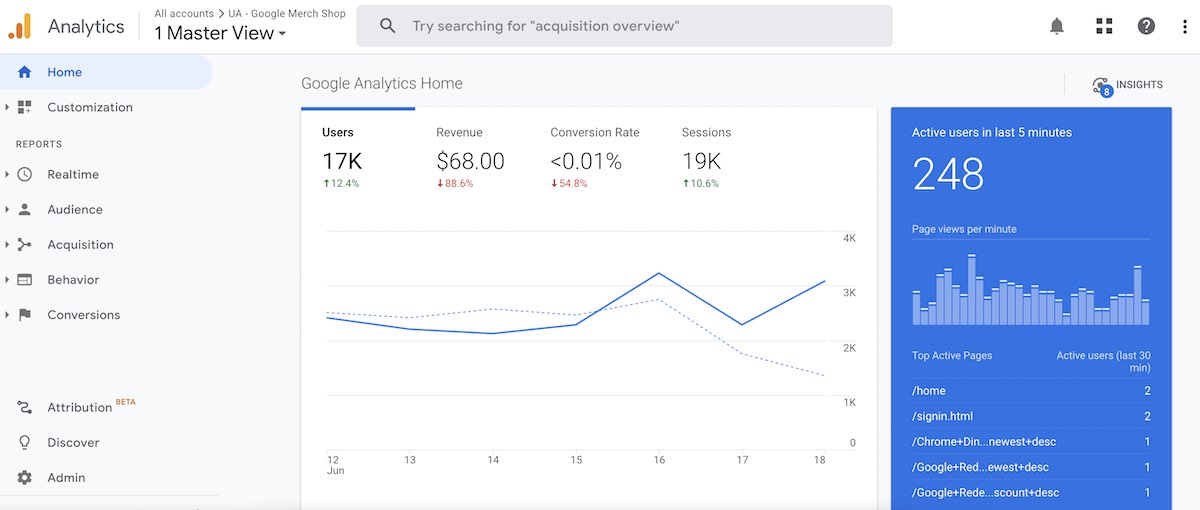
In contrast, here’s what the home view of UA looks like.
There are three major differences between UA and GA4, and we’ve summarized them below. We’ll go over each one in detail so you understand how it impacts your business.
Companies that have a website and a dedicated mobile app had to create separate properties for each in UA. However, GA4 combines both within one property, so you get a more holistic view of how your site and app are performing.
Universal Analytics uses a session-based model for tracking. In plain terms, it means that UA measures everything around sessions—user interactions that happen within a set time frame. When someone interacts with your site, it’s called a hit.
GA4, on the other hand, uses an event-based model. Instead of tracking a new session when a user returns to a site, GA4 records all events the user completes. What previously counted as hits are now all called events.
With this change, Google hopes to more accurately record users to your site and app. It’s also trying to avoid duplicates (recording the same user that visits your site multiple times).
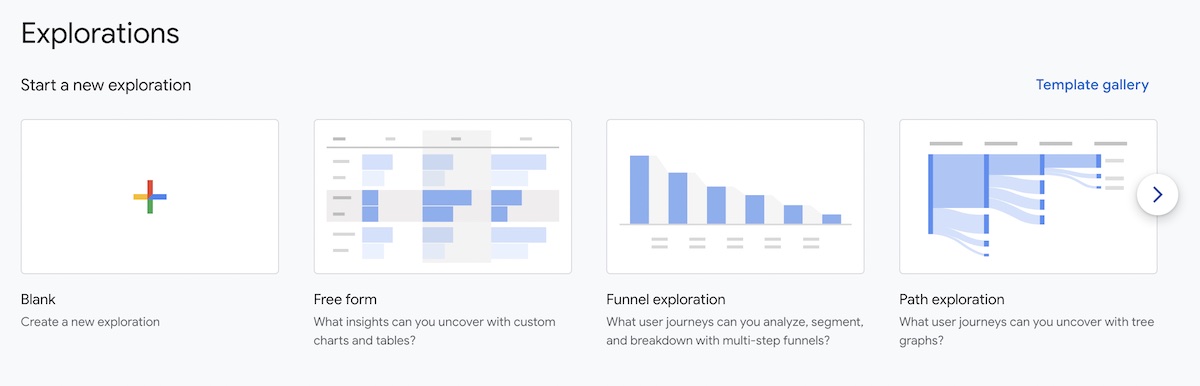
GA4 has built-in reports that overview specific insights including:
To get custom insights from GA4, you’ll go to the Exploration tab in the navigation.
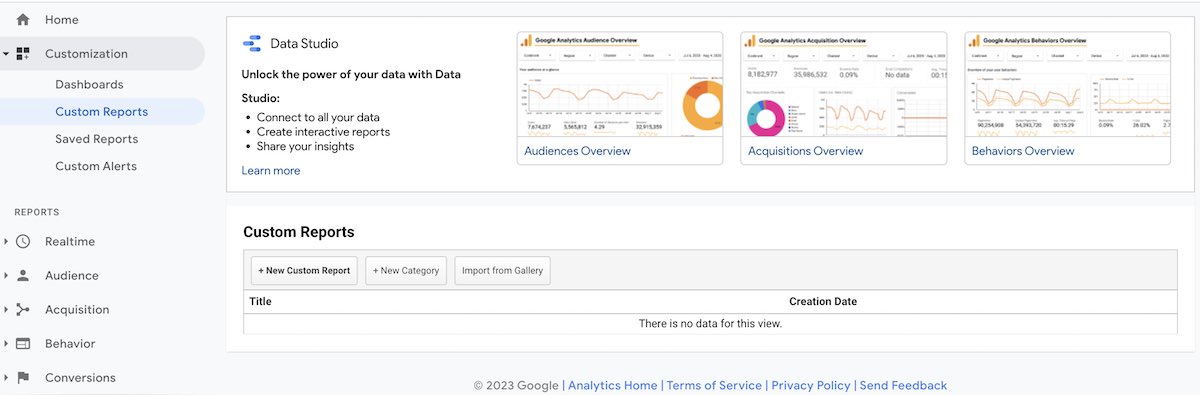
In UA, reports were under customization in the navigation. You could create custom reports and dashboards through Looker, formerly Data Studio, and inside Analytics.
Once you’ve installed Google Analytics, it will start collecting data for your website. But, there are a lot of different data points. How do you make sense of the information and use it to improve your business?
For the uninitiated, the Google Analytics interface can be intimidating. But, remember: Once you know your way around it, you can better cater your content to your audience.
Here’s a Google Analytics for beginners guide that shows you the most important features.
To understand where your website visitors are coming from, you’ll go to Reports > Acquisition > Traffic Acquisition.
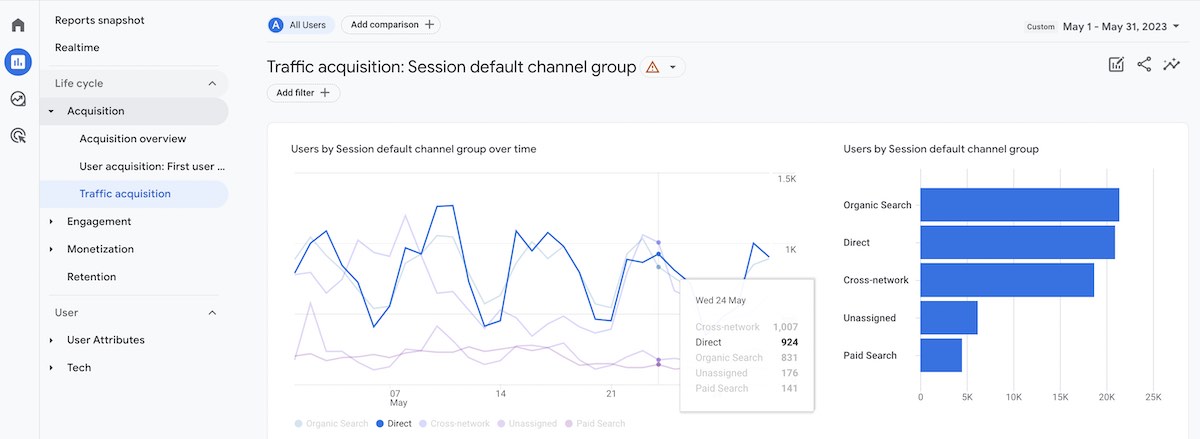
The screen will look something like the one above, and you’ll see various traffic sources including:
You might also see email, organic shopping, affiliates, organic video, and some other sources depending on where your traffic originates.
Inside the Traffic Acquisition report, you can scroll down and view more details like:
If you’ve used UA, this may look familiar. But, there are some changes to website metrics to note.
Looking at the pages that drive the most traffic, engagement, and conversions, can reveal which content or products your audience likes most. With this knowledge, you can build a more effective content strategy or identify which products to put your marketing dollars toward.
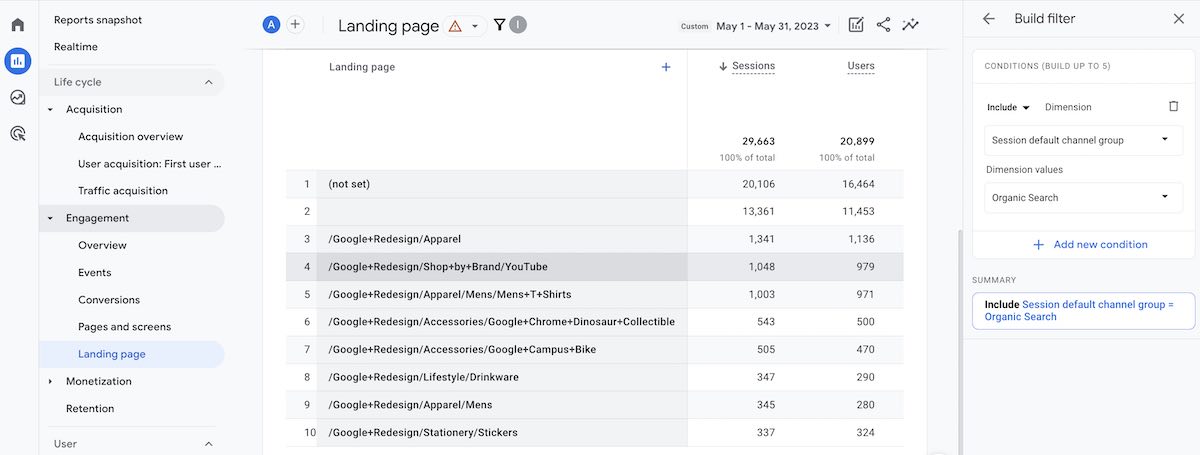
In GA4, you can view the top pages by going to Reports > Engagement > Landing page. If you also have a mobile app, you can view app and web analytics together in the Pages and Screen report. But, to focus on the website alone, you’ll look at the landing pages instead.
The landing page report will show you which pages had the most visits in the time period you select. You can also scroll over and view other metrics like time per session, conversions, and revenue.
If you want to view visitors by channel, you’ll need to create a filter like the one below. For example, to look at organic, you’d select “Session default channel group” and check “Organic search”.
GA4 reports now include a monetization view. You can select a time range and get an overview of how much money or total revenue you’ve generated.

When you scroll down, you can also view the average revenue per user or how much each customer typically spends. You can use this information to help you decide how much you can spend on advertising campaigns to acquire new customers.
Beside it are the top-selling products (in terms of units, not average order value).
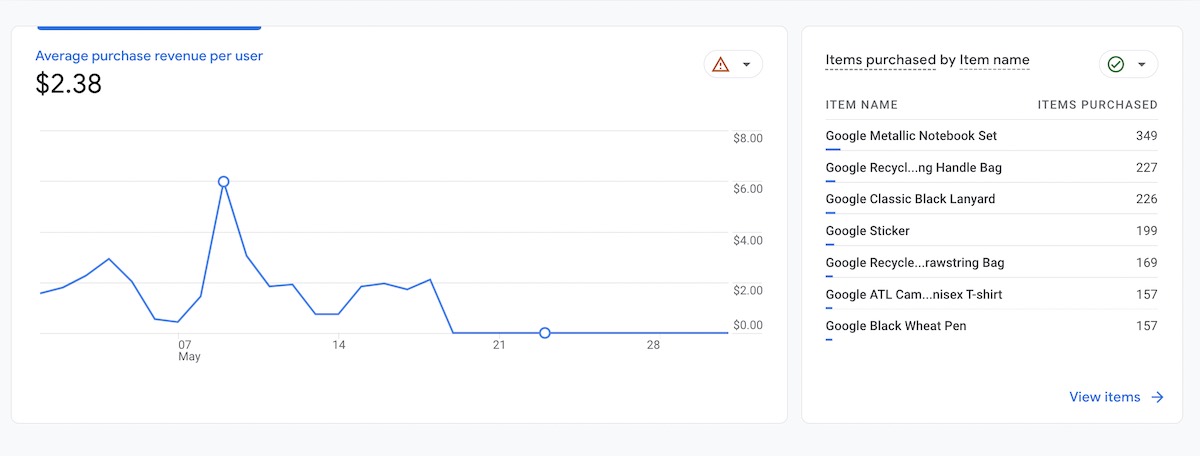
With this information, you can understand which products sell best and think about other products to create. For example, if you know your best-selling product is an influencer media kit template, you might create and offer another one with a different design.
A conversion event, formerly called goals in UA, is an action that you want users to take. It’s usually something that’s important to your overall business goals like a purchase, email lead, or free trial sign up.
Note: All conversions are called events in GA4. Setting them up can seem more advanced, but it will help you track actions that influence your bottom line.
To set up events, you can go to Admin > Events > Create event.
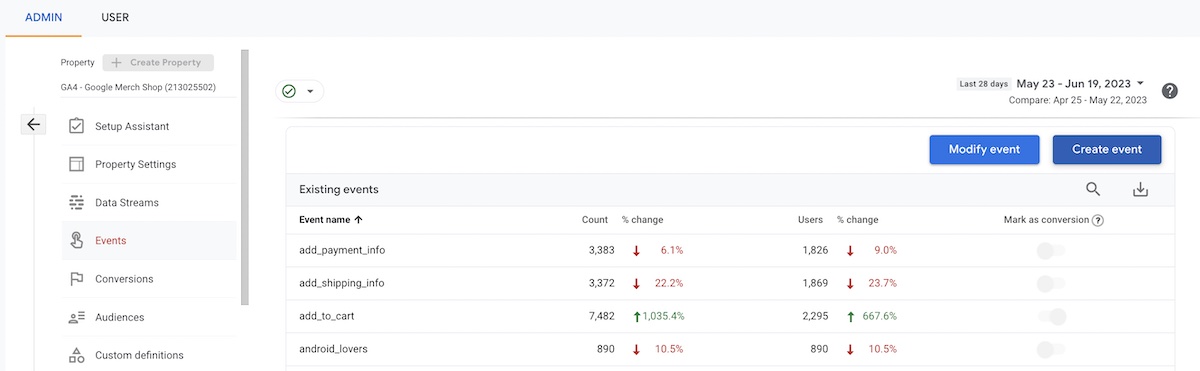
If you’re unsure how to name your events or which to set up, you can view Google’s event recommendations.
That quick introduction to Google Analytics for beginners only scratches the surface. The analytics dashboard is robust, and we covered the basics of what you should know about each section. To get the most out of Google Analytics, install it on your website and view the data firsthand.
Google Analytics is a free tool that tracks and reports website and mobile traffic. You can use the platform to better understand your traffic, sources, audience, pageviews, website referral sources, trending keywords, audience behavior, and more.
Google Analytics works by inserting a bit of code on your website. This bit of code tracks and reports how users interact with your website and apps. Then, you can view this data for free in the Google Analytics platform through charts, dashboards, and more.
You can get a full picture of your site’s performance by viewing data from Google Analytics, Google Search Console, and Google Tag Manager.
Google Analytics doesn’t collect PII or personally identifiable information. This term refers to any information that can be directly tied to a particular person. Examples of information you can collect include: a person’s full name, social security number, date of birth, credit card number, email address, home address, passport number, or driver’s license number. As part of security compliance, this information is kept private by Google.
It’s free to take the Google Analytics certification exam. Google offers a free exam called the Google Analytics Individual Qualification exam or GAIQ. To pass the Google Analytics certification exam, you have to answer 70 questions in 60 minutes. You can visit Google Analytics Academy, to take courses and prepare for the exam.
