Thank you! Your submission has been received!
Oops! Something went wrong while submitting the form.
MENU

You’ve done it: your course is created, audience built, doors opened, and sale after sale rolled in. Now, it’s time to relax, right? Well, not quite. After all of the chaos surrounding your first launch, you might never want to have to think about launching again. But you might want to reconsider.
Whether this was your first launch or your fiftieth, it’s got something to teach you. And whether you consider your launch a success or a failure or something in between, by analyzing what worked and what didn’t, you can better prepare for future launches.
Before we get started, let us say this: If you haven’t launched your online course, make tracking and analyzing your data part of your overall strategy from the get-go. It will save you time and help you better understand just what is happening with your launch.
Not only that, but it’s a lot easier to make note of what is and isn’t working in real time than it is to go back and retrospectively figure out what your high and low points were. With that said, even if you launched months ago, it’s never too late to go back and dig out the data and figure out what did and didn’t work.
When it comes to digging up data, there are a few key places to look:
Of course, there are other places to monitor as well, if you ran paid ads for example, or if you hosted webinars. If you’re using additional promotional strategies during your online launch that aren’t mentioned in this blog post, make sure you’re being diligent in tracking the traffic and conversions they sent you, too.
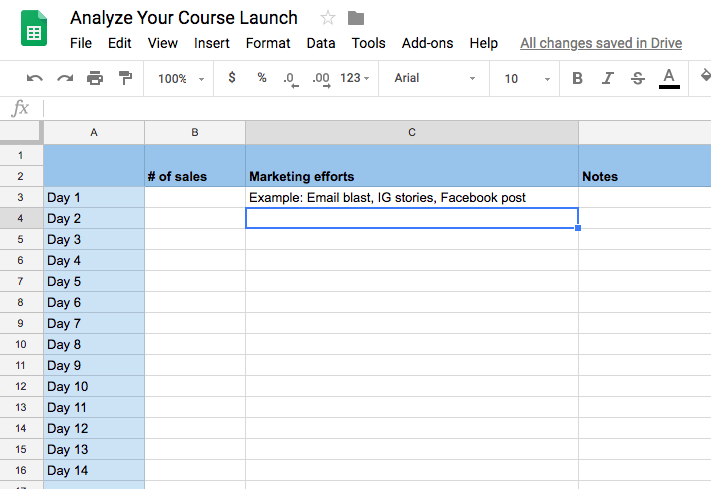
We made a very simple spreadsheet you can use to track and analyze your data, you can access that here. To use it, first go to ‘file’ > make a copy and then fill out the spreadsheet as we go along through this blog post (or during your next launch!).
The first and easiest place to look for launch data is within your Teachable school.
First, we’re going to take a look at how your day-to-day sales went during your launch window. To do so, log in to your Teachable account and check your analytics and take a look at how many sales you made each day. Your chart should look something like this:
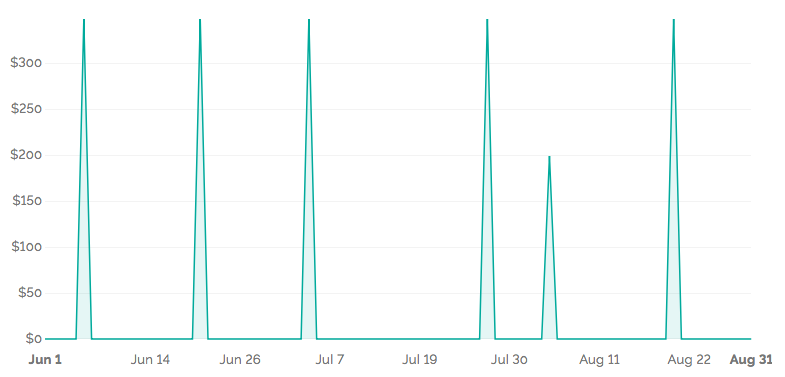
If you had a fourteen day launch period, you’ll be able to look and see which days are the most profitable. Once you know that information, you can reverse engineer your launch and figure out what you did differently on those days.
With that said, be aware that the first two days and the last day of your launch will probably have inflated sales because people get excited to buy during your pre-launch and your most dedicated audience members will buy right away, and there is a lot more urgency during the last day of your launch.
Once you have that data, input your daily sales in to your spreadsheet.
Next, log in to your email management system and take a look at your email analytics. During your launch, your email list is the most likely to convert and purchase your online course, so you’ll likely find a wealth of information here.
Email analytics are useful because they can show you where people are engaging—or not engaging—within your launch strategy.
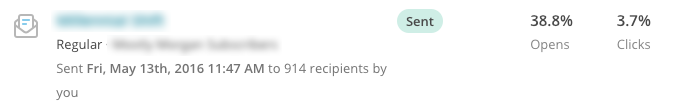
For example, take a look at your open rates. You’ll likely find that some of your emails will have stronger open rates than others. From there, analyzing the subject lines that your audience responded well to, and the subject lines they didn’t respond well to, can help you determine what works and what doesn’t.
Let’s pretend that our launch subject lines and open rates looked like this:
From those open rates, we’d be able to deduce that our audience needs a bit of mystery and suspense to react well to our emails. If they know that an email is about our course, they’ll be less likely to open because they’ve already seen us promoting the course on social media.
On the other hand, if they feel like they’re out of the loop or missing some information or opportunity, they’ll be curious and more likely to open our emails. Beyond the subject lines, you may also notice that the click-through rate in certain emails is much higher than average, which could indicate what content or CTAs resonated best with your readers.
For example, on day four of your launch you might add in a fast action bonus—anyone who purchases today only will get a free one-on-one consultation with you. That email will probably have a significantly higher click-through rate than an email that just says, “Don’t forget! My course doors are open for five days only!”
Incentivizing people to take action is typically more effective than just asking them to take action.
Google Analytics can be an intimidating platform, so if you need to get up to speed, our Google Analytics for beginners post is a great place to start. Once you’re logged into Google Analytics, you’ll want to navigate to data surrounding your course sales page. In particular, see where your traffic came from.
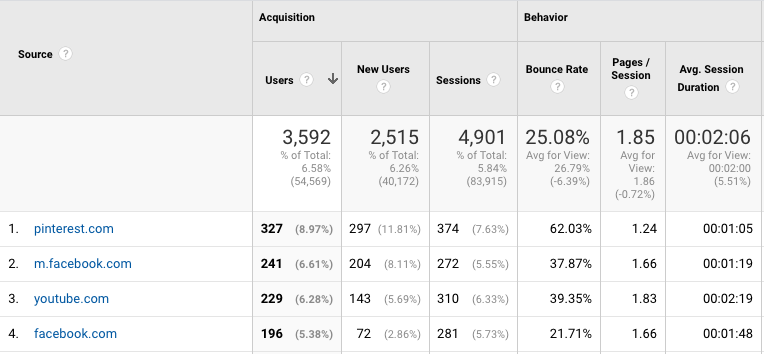
Was it predominantly email? Or maybe your Instagram efforts? Regardless, it’s great to see a visual representation of where your efforts were most valuable.
In the spreadsheet, there’s a space to record how many views and conversions each platform drove, as well as a space for you to make notes on how much time you spent on each platform and what you would do differently next time.
There’s one other data source we want to talk about briefly, and that’s survey data. Unlike revenue, email, and page analytics, surveying your buyers or your non-buyers requires you to proactively ask for data from your audience directly instead of merely observing their behaviors. Surveys can help you understand two important groups of people.
You can ask students why they decided to make a purchase, or what they’re hoping to gain from your course, and you can also ask non-buyers why they didn’t purchase. These non-buyer surveys can help you with anything from updating your marketing to deciding what course you need to offer next.
Whether you use the provided spreadsheet or create your own system, the most important thing you can do is record your results and theorize why things worked or didn’t while your launch is still fresh in your mind. It would be easy to convince yourself that you’ll remember every detail of your launch, but if you’re not launching again for another three or four months, a lot will slip through the cracks when it comes time to plan.
If you’re continuously recording, monitoring, and making adjustments, you’ll be able to better plan your future launches and break your launching down to a science. Once you’ve finished documenting your launch, take 20 minutes to make a bullet list breaking down what you’d do the same and what you’d change for your next launch. In a few months when it’s time to launch, refer back to this list as a refresher.
Do you analyze your course launches? What was the most valuable thing you’ve learned from reflecting on past launches? Share with us on social media.
{{todolist-component="/blog-shortcodes/blog-popup"}}